Engineers
The FluidDruid™ reduces detention volume by achieving the maximum allowable discharge very early in a rain event – much earlier than a standard orifice.
This is shown by the example in Figure 1.

In this graph, the discharge rate for a standard orifice is shown with the orange dotted line at a maximum allowable discharge rate of 0.56 CFS. The area left of the orange line extending up to 0.56 CFS on the vertical axis represents water in a rain event that must be detained. The FluidDruid™ (the blue dotted line) greatly reduces this volume by achieving the maximum allowable discharge rate very early in the rain event. In the same way, the FluidDruid™ reduces drawdown time, thus reducing the chance of flooding.
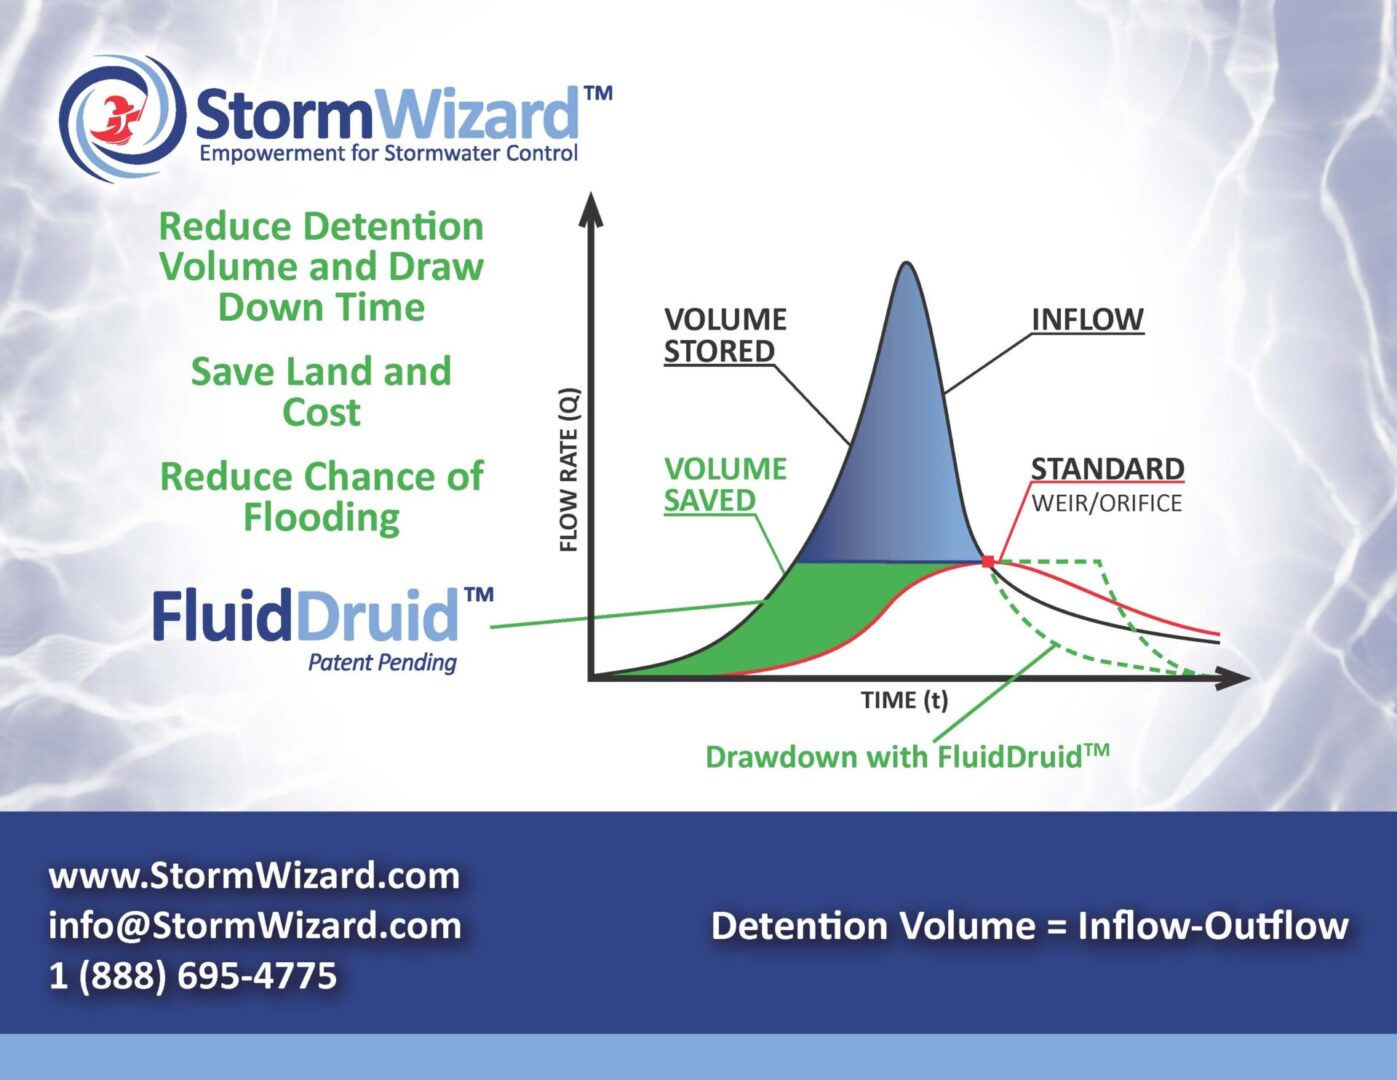
Figure 2 shows this effect another way.

This hydrograph depicts runoff during a rain event. All the rain beneath the curve that isn’t discharged must be detained. The red line depicts the discharge from a standard orifice. All the area in the hydrograph shown in blue and green must be detained. When the FluidDruid™ is used, the green area can be eliminated from the detention volume.
It is important to note that the FluidDruid™ effectiveness is driven solely by the discharge limits and the hydraulic head in the detention system. The stricter the jurisdiction’s discharge limit, and the higher the head in the detention system, the greater the percentage reduction in detention volume the FluidDruid™ will be provided.
In addition to saving detention volume, the FluidDruid™ reduces draw down time. This reduces the risk of flooding and gives vectors (mosquitos) less chance to breed.

StormDruid™ Software
If you have a project where the detention volume has been driven up by these factors, give us a call. We’ll send you our StormDruid™ software for sizing and specifying a FluidDruid™.
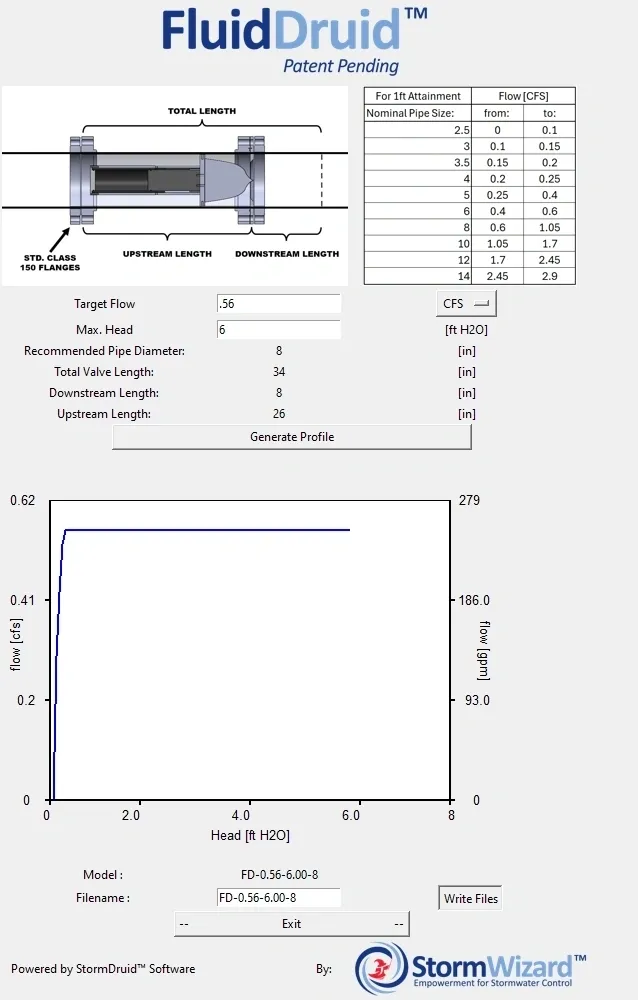
StormDruid™ makes this process relatively easy. All you need to do is enter the maximum allowable discharge rate for the storm you’re modeling and the maximum head in the detention system. StormDruid™ will automatically select the optimal valve for those conditions. It will also generate a downloadable discharge curve for your project in digital format that can be uploaded into your hydraulic model. This will allow you to run various scenarios with relative ease.
At the same time, StormDruid™ will provide an output file with all the necessary information for specifying the system. No more waiting for shop drawings – you will have them right in your hands - and they can be incorporated into your plan sheets for review and approval!
An example output from StormDruid™ is shown as follows.


